Courses
 Popular
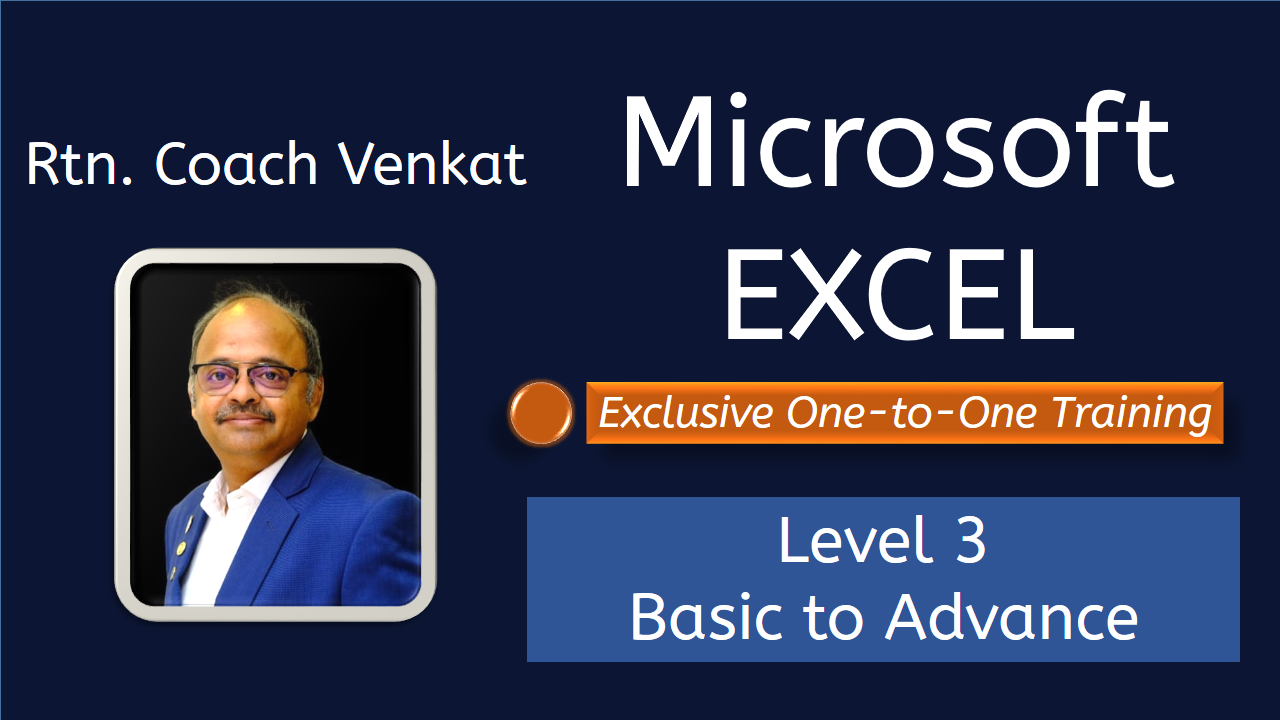
Microsoft Excel for Data Analysis - Advanced Level 3
Duration: 22 Exclusive One-to-One sessions (Weekly 3-4 Sessions)
Price: ₹14,000.00
₹25,000.00
Our Advanced Excel Training Program is designed to equip students, freshers, and professionals with job-ready analytical skills. Excel remains the most widely used tool in the Data Analyst profile, and this course ensures you are trained on current industry trends with hands-on projects.
Available Slots
Course Description
1
Basic Aggregation and Conditional Aggregation
- SUM, SUMIF, SUMIFS, COUNT, COUNTA, COUNTIF, COUNTIFS, COUNTBLANK, MIN, MAX, SUMPRODUCT, AGGREGATE, SUBTOTAL
2
Conditional Logic Functions
- IFS, IF, AND, (Nested IF functions), MINIFS, MAXIFS
3
String/Text Manipulation
- LEFT, RIGHT, MID, PROPER, CONCATENATE, LEN
4
Search and Replace Functions
- FIND, REPLACE, SUBSTITUTE, OFFSET
5
Date and Time Functions
- DAY, MONTH, YEAR, WEEKDAY, EDATE, EOMONTH, DATEDIF, NETWORKDAYS, NETWORKDAYS.INTL, WORKDAY, WORKDAY.INTL
6
Lookup and Reference Functions
- VLOOKUP, HLOOKUP, INDEX, MATCH, Database Functions (DSUM,DGET etc)
7
Error Codes and Debugging
- #DIV/0, #NAME, #NUM, #CALC, #SPILL
8
Logical and Error Handling Functions
- ISBLANK, ISERR, ISERROR, ISEVEN, ISODD, ISNUMBER, ISNA, ISNONTEXT, ISFORMULA, ISLOGICAL, ISREF, ISTEXT
9
Useful Functionalities for Efficiency
- CONDITIONAL FORMATTING, CUSTOM FORMATTING, SORT, NAMED RANGES, AUTO FILL, FLASH FILL
10
Data Tables, Pivot Tables, and Charts
- EXCEL TABLES, PIVOT TABLES, TABLES WITH SLICERS, NORMAL CHARTS, PIVOT CHARTS, NAMED RANGES VS. EXCEL TABLE COLUMNS
11
Advanced 365-Specific Functions
- FILTERING AND SORTING FUNCTIONS FILTER, UNIQUE, SEQUENCE, SORT, SORTBY
- TEXT MANIPULATION FUNCTIONS TEXTJOIN, TEXTSPLIT, TEXTAFTER, TEXTBEFORE
- LOOKUP FUNCTIONS XLOOKUP, XMATCH
- COLUMN AND ROW SELECTION CHOOSECOLS, CHOOSEROWS
- ARRAY MANIPULATION TAKE, DROP, VSTACK, HSTACK
- DYNAMIC CALCULATION AND CUSTOM FUNCTIONS LAMBDA, GROUPBY, PIVOTBY, PERCENT OF MUCH MORE NEW FUNCTIONS
12
Introduction To Power Query
- What Is Power Query And Its Significance In Excel.
- Overview Of The Power Query Interface.
- Basic Concepts Query, Data Connection, And Transformation.
13
Importing Data
- How To Import Data from Various Sources (Excel, Csv, Databases, Web, Etc.).
- Understanding The Query Editor Window.
14
Data Transformation Basics
- Basic Data Cleaning And Transformation Techniques.
- Using Built-In Power Query Functions For Common Tasks.
15
Working With Different Data Types
- Handling Different Types Of Data Text, Numbers, Dates, Etc.
- Type Conversion And Formatting.
16
Advanced Data Transformations
- Merging And Appending Queries.
- Pivoting And Unpivoting Data.
17
Filtering And Sorting Data
- Using Filters To Refine Data.
- Sorting Data Based On Various Criteria.
18
Using Formulas In Power Query
- Introduction To The M Language.
- Writing Simple Formulas For Calculated Columns.
19
Error Handling And Data Cleaning
- Identifying And Handling Errors In Data.
- Removing Duplicates And Managing Null Values.
20
Creating Custom Functions And Advanced M Language Techniques
- Building Custom Functions In Power Query.
- Advanced M Language Techniques For Complex Data Transformations.
21
Introduction to Power Pivot
- Understanding what Power Pivot is and its role in Excel data analysis.
22
Enabling Power Pivot in Excel
- How to activate the Power Pivot add-in.
23
Basic Concepts of Data Modelling
- Understanding data models, relationships, and their importance.
24
The Power Pivot Window
- Navigating and using the Power Pivot interface.
25
Importing Data into Power Pivot
- How to bring data into the Power Pivot model.
26
Data Types and Formatting in Power Pivot
- Managing data types and formatting options.
27
Creating Relationships in Power Pivot
- Understanding and creating relationships between different data tables.
28
Understanding Table Relationships
- Exploring one-to-many and many-to-one relationships.
29
Working with Linked Tables
- How to link Excel tables to Power Pivot.
30
Creating Calculated Columns
- Using DAX to add new columns in the data model.
31
Introduction to DAX (Data Analysis Expressions)
- Basics of DAX and its role in Power Pivot.
32
Basic DAX Functions and Formulas
- Learning fundamental DAX functions for calculations.
33
Row Context and Filter Context in DAX
- Understanding these two crucial concepts in DAX.
34
Calculated Fields (Measures) in Power Pivot
- Creating and using measures for advanced calculations.
35
Using KPIs (Key Performance Indicators)
- Setting up and using KPIs in Power Pivot.
36
Data Analysis Using PivotTables with Power Pivot
- Leveraging PivotTables in combination with Power Pivot.
37
Advanced DAX Formulas and Functions
- Exploring more complex DAX calculations.
38
Time Intelligence in DAX
- Working with dates and time-based data.
39
Handling Errors and Debugging DAX Formulas
- Techniques for troubleshooting DAX formulas.
40
Power Pivot and Power Query Integration
- Combining Power Pivot with Power Query for more dynamic data models.
Course Duration & Topics
1. Essential for analysing data through totals, counts, and identifying minimum or maximum values within a range. Advanced functions like SUMPRODUCT and AGGREGATE allow more complex calculations with specific conditions, enhancing data analysis capabilities.
2. Conditional functions enable decision-making within formulas by applying logic tests to determine outputs based on specific conditions. With IFS and nested IF statements, users can create tailored responses for various scenarios in data.
3. Text functions help in extracting parts of text, combining different strings, or formatting text entries for clarity and consistency. These are especially useful in cleaning up data and managing textual information like names, IDs, or codes.
4. These functions enable users to locate and replace specific characters or strings within a dataset, which is crucial for data cleanup and standardization. OFFSET adds flexibility by dynamically referencing cells based on criteria.
5. Date functions facilitate operations with dates, such as calculating the number of working days, identifying month-end dates, or finding intervals between dates. Essential for tracking timelines and handling schedule-based data.
6. Lookup and reference functions pull data from specific tables or ranges, enabling users to connect information across different sheets or workbooks. INDEX and MATCH offer dynamic and flexible alternatives to standard lookups, ideal for complex data retrieval.
7. Recognizing error codes helps identify and troubleshoot issues in formulas, such as division by zero or unrecognized text. These codes ensure data integrity by highlighting potential formula or data entry errors.
8. Logical functions validate data and error-handling functions prevent unexpected results by identifying blanks, errors, or specific data types. They provide control over formula outcomes, improving overall reliability.
9. Tools like conditional formatting and named ranges streamline work by organizing data and highlighting patterns. Auto-fill and flash fill functions further enhance productivity by automating repetitive data entry and corrections.
10. Data tables and pivot tables enable organized data summaries, while charts provide visual insights for trends and comparisons. These tools help in presenting data clearly and supporting data-driven decisions.
11. Excel 365 introduces dynamic array functions for real-time data manipulation, allowing users to filter, sort, and reshape data efficiently. Advanced lookup functions (XLOOKUP, XMATCH) and array operations (VSTACK, HSTACK) simplify complex data management tasks
12. Discover POWER QUERY with 9 Scenarios
13. Discover POWER Pivot with 20 Scenarios
Who Can Join?
- Freshers who want to enter IT/Analytics field or transition from Non-IT to IT
- Students preparing for job opportunities
- Professionals planning a career transition
- Anyone interested in Data Analytics