Blogs
We provide online programming courses and tutorials suitable for all levels.
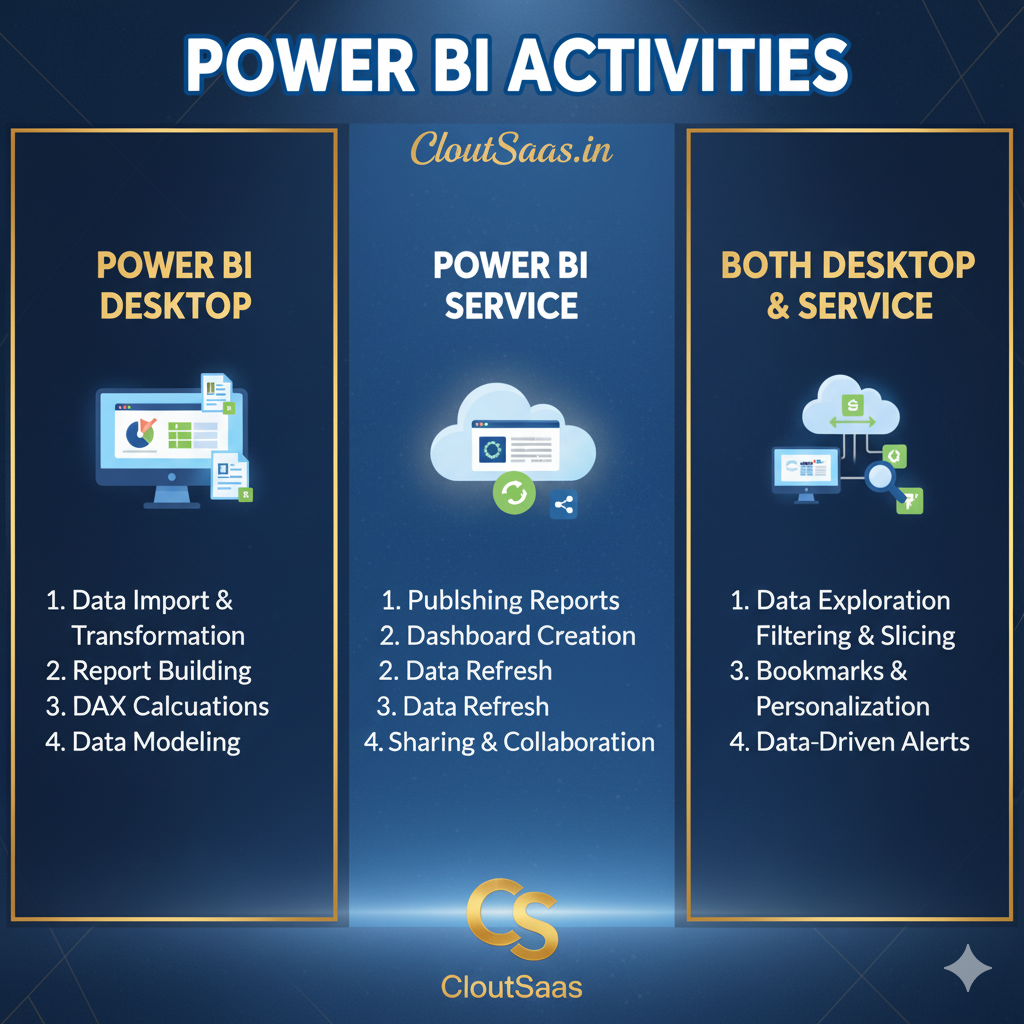
Activities Carried Out in Power BI Desktop, Power BI Service, and Both
Published on 28 Oct 2025
Activities Carried Out in Power BI Desktop, Power BI Service, and Both
Power BI is one of the most powerful Business Intelligence tools used by professionals to transform raw data into actionable insights. However, many beginners often wonder which tasks are performed in Power BI Desktop, which ones belong to Power BI Service, and which are available in both.
Activities in Power BI Desktop
Power BI Desktop is the development environment where reports and data models are created. It’s primarily used by report developers and analysts for data preparation, modeling, and visualization.
Here are the key activities you can do in Power BI Desktop:
-
Connecting to Data Sources
-
Import data from Excel, SQL Server, CSV, Web, and many other sources.
-
Establish DirectQuery or Import connections.
-
-
Data Cleaning & Transformation
-
Use Power Query Editor to clean, filter, merge, and shape data.
-
Perform data type conversion, column splitting, and apply transformations.
-
-
Data Modeling
-
Create relationships between multiple tables.
-
Define hierarchies and set up cardinalities.
-
Implement DAX (Data Analysis Expressions) for calculated columns and measures.
-
-
Data Visualization
-
Build interactive visuals, charts, and tables.
-
Use slicers, filters, and custom visuals to enhance user experience.
-
-
Report Formatting & Layout
-
Customize themes, fonts, colors, and background designs.
-
Arrange visuals and create navigation buttons for better storytelling.
-
-
Creating Parameters & What-If Scenarios
-
Add parameters to make reports more dynamic.
-
Simulate scenarios using What-If parameters.
-
-
Publishing Reports
-
Publish completed reports to the Power BI Service for sharing and collaboration.
-
Activities in Power BI Service
Power BI Service (also called PowerBI.com) is the online platform where reports and dashboards are shared, refreshed, and managed. It’s used by business users, administrators, and teams for collaboration and consumption.
Here are the main activities done in Power BI Service:
-
Creating and Managing Workspaces
-
Organize content using workspaces (My Workspace, Shared Workspaces).
-
Assign roles (Viewer, Member, Contributor, Admin).
-
-
Sharing and Collaboration
-
Share reports, dashboards, and datasets securely.
-
Use Power BI Apps to distribute content to larger audiences.
-
-
Dashboard Creation
-
Pin visuals from multiple reports to create consolidated dashboards.
-
Add tiles like text boxes, KPIs, and images.
-
-
Data Refresh and Scheduling
-
Configure automatic refresh schedules for your datasets.
-
Monitor refresh status and data connectivity.
-
-
Setting up Row-Level Security (RLS)
-
Manage and enforce data access control at the user level.
-
-
Alerts and Subscriptions
-
Create data-driven alerts to notify users when thresholds are reached.
-
Subscribe to reports or dashboards for automatic email updates.
-
-
Integration with Other Tools
-
Embed reports into Microsoft Teams, SharePoint, or external applications.
-
Connect with Excel via “Analyze in Excel”.
-
-
Performance and Usage Insights
-
View usage metrics and monitor dataset performance
-
Activities Available in Both Power BI Desktop and Power BI Service
Some capabilities are available in both environments — though the approach or purpose might differ slightly.
Here are the common activities you can perform in both Power BI Desktop and Power BI Service:
-
Creating Visuals and Reports
-
Both environments support building visuals; however, Desktop offers more design flexibility.
-
-
Applying Filters and Slicers
-
Users can apply filters or slicers in both to interact with data.
-
-
Exploring Data
-
Use features like “Drill Through”, “Drill Down”, and “Focus Mode” to analyze data interactively.
-
-
Using DAX Calculations
-
DAX measures and calculated columns work in both, though most are created in Desktop.
-
-
Viewing and Interacting with Reports
-
You can explore and interact with reports in both environments, though Desktop is mainly for authors and Service is for end users.
-
Power BI